
Early signs of recovery in the housing market signal a rebound in residential building activity, says economist Rodney Dickens.
![]()
There are early signs of recovery in the housing market. As fallout from the fall in economic activity last year – the ‘recession’ - continues, interest rates should fall more and ensure a solid rebound in residential building starting by mid-year 2025 and flowing into 2026.
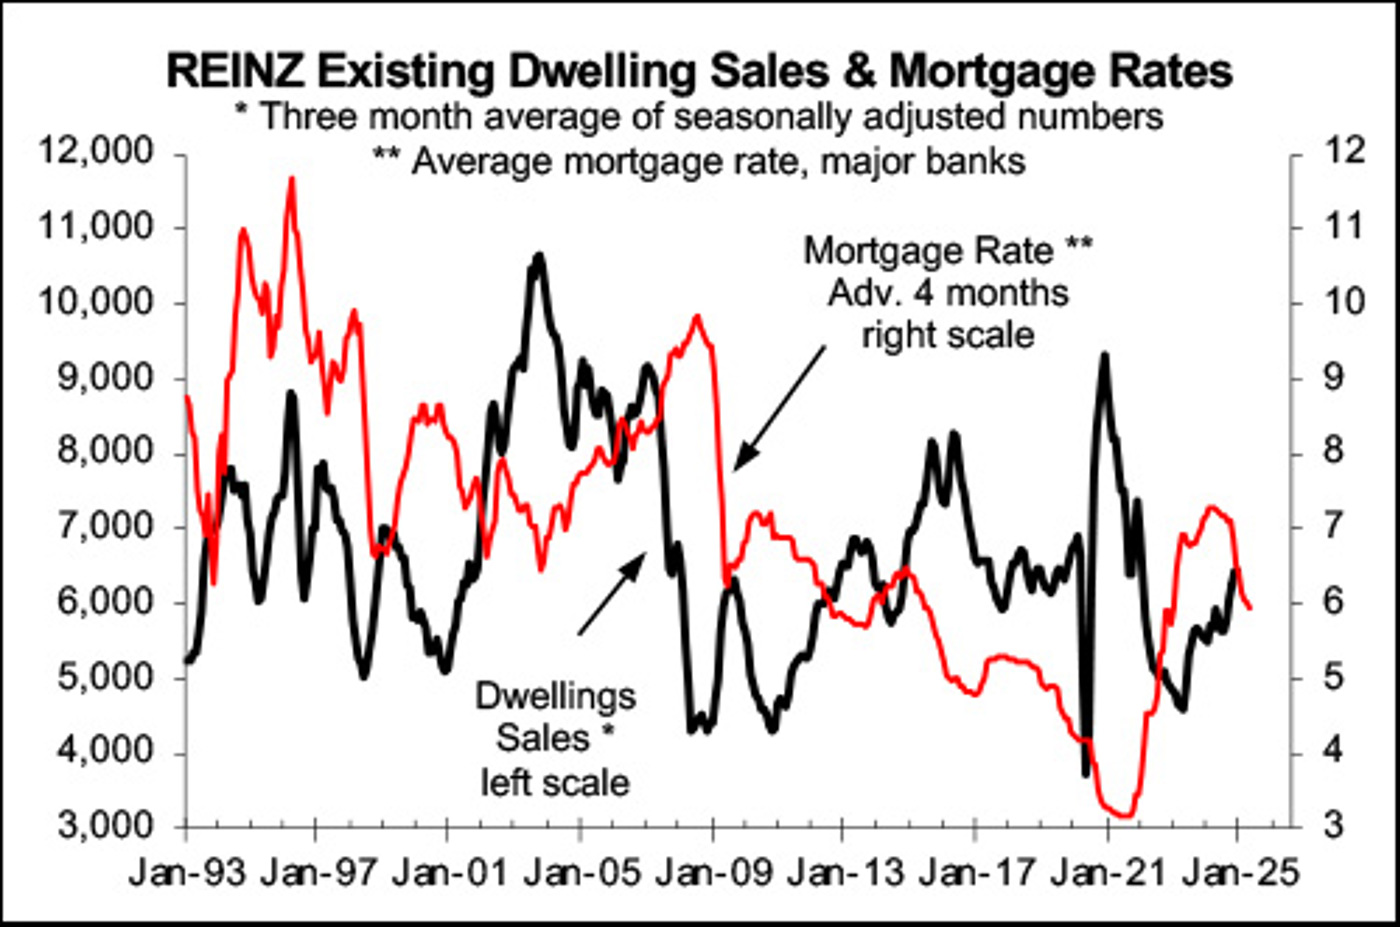
Existing dwelling sales reported by REINZ take around four months to respond to mortgage interest rates. This is shown in the first chart, with three-month average REINZ sales (black line, left scale) having increased 13% in the second half of 2024 in response to the initial fall in interest rates. The red line is the average mortgage rate offered by the major banks and has been advanced or shifted to the right by four months, reflecting how long it generally takes mortgage rates to impact on sales.
REINZ sales should increase more in the coming four months in response to the fall in mortgage rates over the last four months, while there is a good case for expecting interest rates to fall more. This is a good sign for new housing demand that should be already starting to recover. However, it takes around 13 months for mortgage rates to impact on new dwelling consents so upside in consents should start by mid-year and become more evident in H2.
As well as it taking time for interest rates to impact on existing dwelling sales and new dwelling consents, there are other lags in the economy that will work in favour of interest rates falling more this year.
It takes around three months to upturns and downturns in the economy to impact on the unemployment rate meaning it should continue to increase over at least H1 2025 following the fall in economic activity last year – the “recession”. Changes in the unemployment rate in turn take almost a year to impact on wage and price inflation that are key to interest rates.
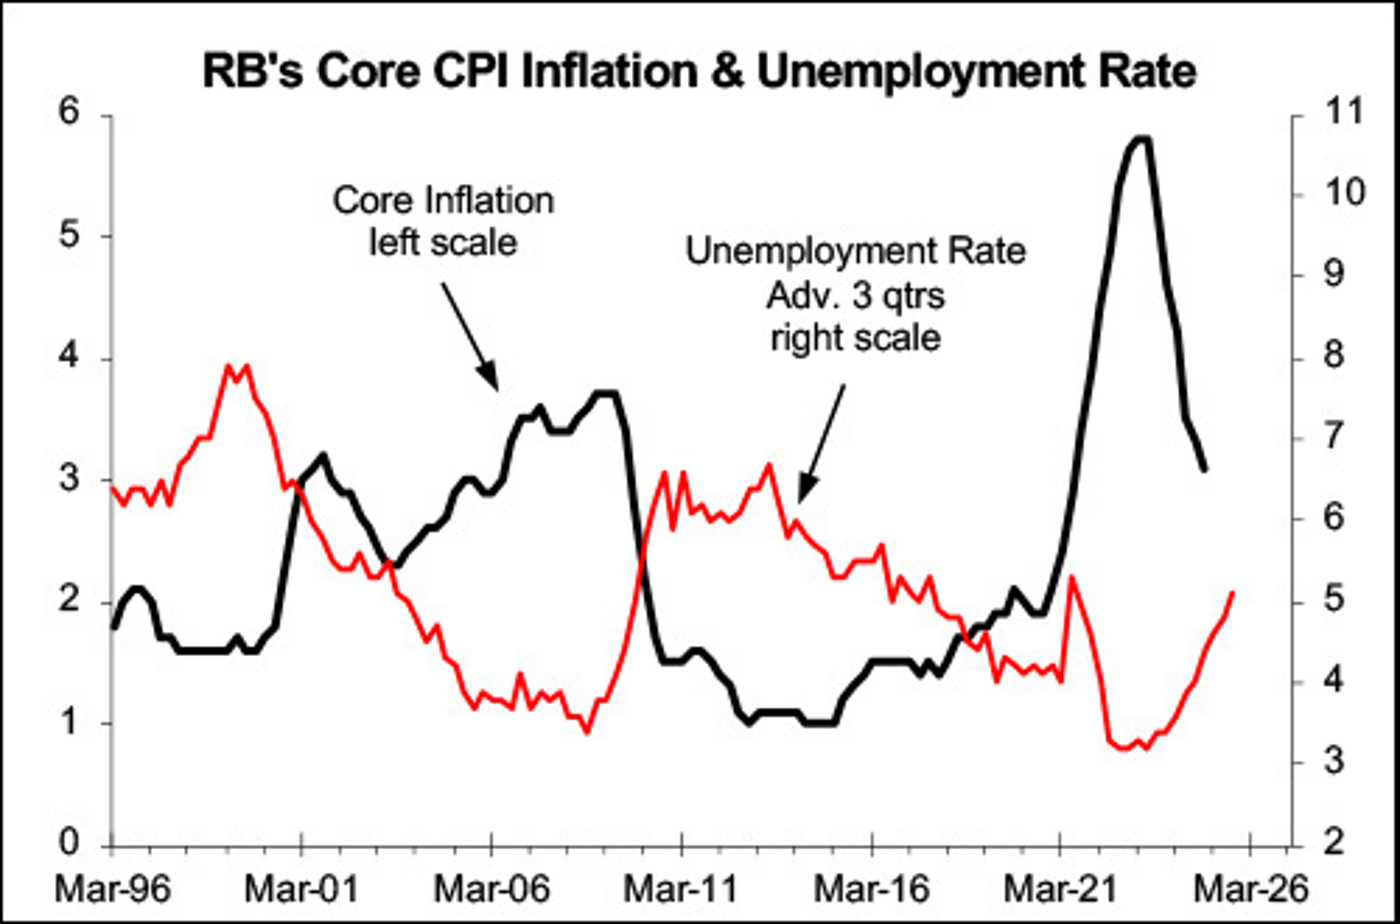
The second chart shows the unemployment rate to be a useful predictor of what the Reserve Bank’s measure of core consumer price (CPI) inflation will do (black line, left scale). The best fit is with the red unemployment line (right scale) advanced or leading by three quarters. The core measure removes the impact of volatile factors and better shows underlying price inflation. The continued rise in the unemployment rate should mean core CPI inflation continues to fall until around mid-2026.
The RB generally reacts to inflation news so as price inflation continues to fall over the next year and probably a bit longer, the RB should keep cutting the OCR roughly as it currently predicts. This should mean a solid rebound in residential building.
![]()
